🧙‍♂️DataWhizard🌎[English]

💪《Diet: Powered by Data⑥》🥹 “I ate to ease my mind… now my body feels heavier.

🧙‍♂️Data Whizard🧙‍♂️데이터 지식 마법사 2025. 6. 16. 00:20
반응형


🎯 Self-Esteem: Measured on the Scale

🥹 "I ate because my heart was heavy… now, my body is heavier."

English: Two-image collage with
wo-image collage with "Before" and "After"

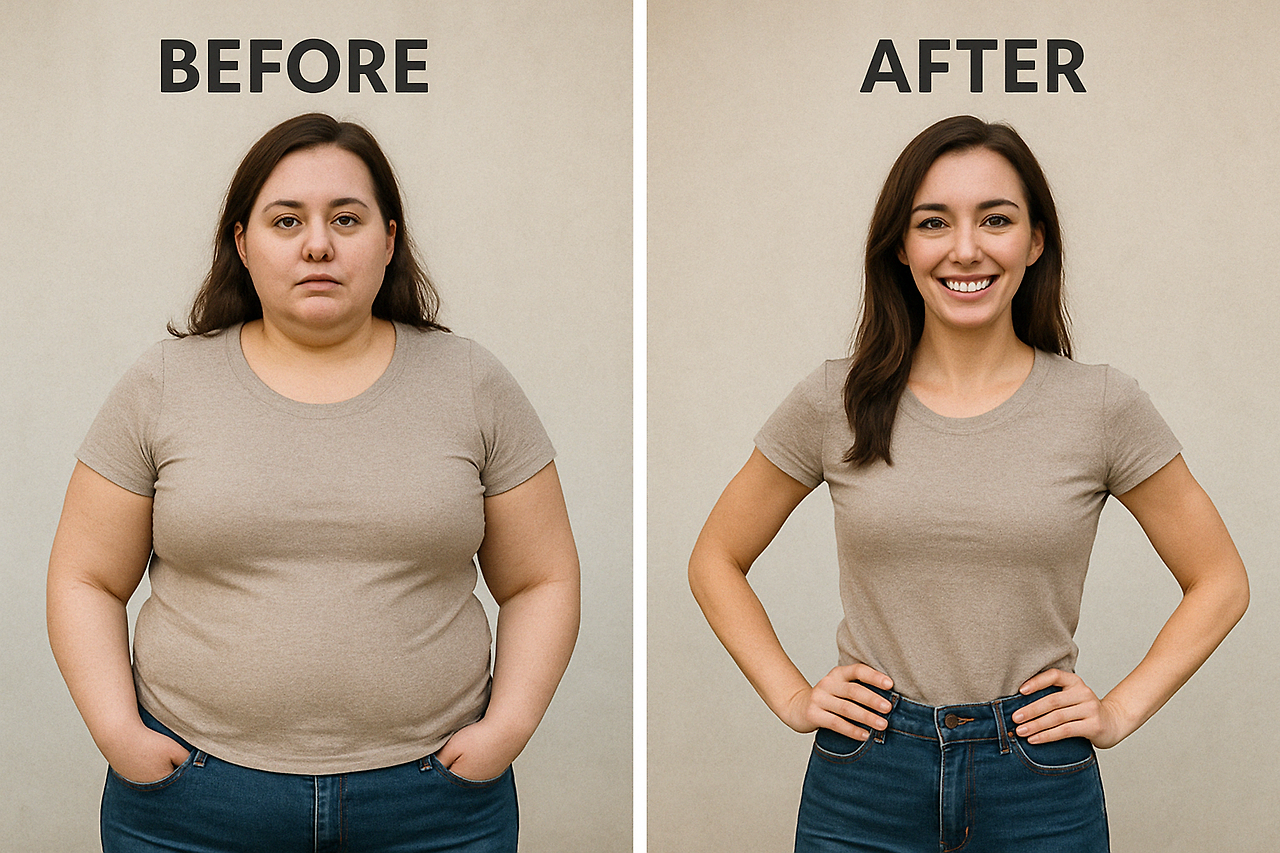
An emotional reversal: the core of stress eating, revealed through numbers and personal battles.

 
😵‍💫 Stress makes us eat more. More eating leads to weight gain…
😔 The heavier our body feels, the more we avoid mirrors. Our mood dips…
🪞 But the real issue was never the weight itself. It was about the stories we tell ourselves in front of that mirror.
📊 When we looked at the data, what truly weighed us down wasn’t our body—it was self-esteem. The shame triggered by a number on the scale can lead to emotional self-abandonment. That emotional burden loops back, and we soothe ourselves the only way we know: with food.
This creates a vicious emotional loop that reinforces itself silently.
💡 Food may comfort briefly, but it can’t fill the emotional void. The relief is momentary. The aftermath—a stomach full of guilt—is familiar. Maybe all along, what we needed wasn’t a snack, but that reassuring inner voice that gently says:
"You are enough, even now."
🧙‍♂️ That’s why today, The Data Whizard breaks this cycle—through numbers, truth, warmth, and empathy. Through real data, real emotions, and honest storytelling, we shine light on the hidden connection between stress, weight, and self-worth. Ready for the truth behind your cravings?

📌 Magical Data Details
  • 📚 Data Source: Youth Panel Survey (YPS), Wave 10 — one of Korea’s most comprehensive national datasets on youth life, emotions, and behavior.
  • 👥 Sample: A total of 4,500 Korean young adults between the ages of 18–34, representing urban and rural demographics, varied educational backgrounds, and a spectrum of lifestyle patterns.
  • 🔢 Model: Multiple Linear Regression (MLR) — a statistical tool that helps us examine how multiple lifestyle and economic factors simultaneously influence one’s mental health status.
  • 🧾 Key Variables: 🧠 Mental Health Score, 🍽️ Diet Status, 👶 Age, 💸 Income, 🏃 Physical Activity — selected based on their relevance to personal well-being, self-perception, and behavioral health.
  • 📊 Stata Command: regress mental_health_score diet_status age income physical_activity — a simple yet powerful command that unveils significant insights from everyday lives.
  • English: A formula starting with a brain icon and "Mental Healthᵢ =". It is followed by a constant term β 
0
​
 , plus the product of coefficient β 
1
​
 and a circle with the letter R inside representing Dietᵢ, plus the product of coefficient β 
2
​
 and a baby face icon representing Ageᵢ. The next line adds the product of coefficient β 
3
​
 and a money icon representing Incomeᵢ, plus the product of coefficient β 
4
​
 and a sparkling star icon representing Activityᵢ, and finally the error term ε 
i
​
 . This formula appears to be a regression analysis model examining the impact of diet, age, income, and activity levels on an individual's mental health.
日本語: 脳のアイコンと「Mental Healthᵢ =」で始まる数式。続いて定数項β 
0
​
 、係数β 
1
​
 と食事ᵢを表す丸にRの記号が入ったものの積、係数β 
2
​
 と年齢ᵢを表す赤ちゃんの顔のアイコンの積が加えられています。次の行では、係数β 
3
​
 と収入ᵢを表すお金のアイコンの積、係数β 
4
​
 と活動ᵢを表す輝く星のアイコンの積が加えられ、最後に誤差項ε 
i
​
 が加えられています。この数式は、食事、年齢、収入、活動レベルが個人のメンタルヘルスに与える影響を分析する回帰分析モデルであると思われます。
中文 (简体): 一个以大脑图标和“Mental Healthᵢ =”开头的公式。其后是常数项 β 
0
​
 ,加上系数 β 
1
​
 与代表饮食ᵢ的圆圈内字母 R 的乘积,加上系数 β 
2
​
 与代表年龄ᵢ的婴儿脸图标的乘积。下一行加上系数 β 
3
​
 与代表收入ᵢ的钱币图标的乘积,加上系数 β 
4
​
 与代表活动ᵢ的闪耀星星图标的乘积,最后加上误差项 ε 
i
​
 。这个公式似乎是一个回归分析模型,旨在研究饮食、年龄、收入和活动水平对个人心理健康的影响。
Deutsch: Eine Formel, die mit einem Gehirn-Symbol und „Mental Healthᵢ =“ beginnt. Es folgt ein konstanter Term β 
0
​
 , plus das Produkt aus dem Koeffizienten β 
1
​
 und einem Kreis mit dem Buchstaben R darin, der für Ernährungᵢ steht, plus das Produkt aus dem Koeffizienten β 
2
​
 und einem Babygesicht-Symbol, das für Alterᵢ steht. In der nächsten Zeile wird das Produkt aus dem Koeffizienten β 
3
​
 und einem Geldsymbol, das für Einkommenᵢ steht, plus das Produkt aus dem Koeffizienten β 
4
​
 und einem funkelnden Sternsymbol, das für Aktivitätᵢ steht, addiert, und schließlich der Fehlerterm ε 
i
​
 . Diese Formel scheint ein Regressionsanalysemodell zu sein, das den Einfluss von Ernährung, Alter, Einkommen und Aktivitätsniveau auf die psychische Gesundheit einer Person untersucht.
Français: Une formule commençant par une icône de cerveau et « Mental Healthᵢ = ». Elle est suivie d'un terme constant β 
0
​
 , plus le produit du coefficient β 
1
​
 et d'un cercle avec la lettre R à l'intérieur représentant Régimeᵢ, plus le produit du coefficient β 
2
​
 et d'une icône de visage de bébé représentant Âgeᵢ. La ligne suivante ajoute le produit du coefficient β 
3
​
 et d'une icône d'argent représentant Revenuᵢ, plus le produit du coefficient β 
4
​
 et d'une icône d'étoile brillante représentant Activitéᵢ, et enfin le terme d'erreur ε 
i
​
 . Cette formule semble être un modèle d'analyse de régression examinant l'impact du régime alimentaire, de l'âge, du revenu et des niveaux d'activité sur la santé mentale d'un individu.
Español: Una fórmula que comienza con un icono de cerebro y "Mental Healthᵢ =". Le sigue un término constante β 
0
​
 , más el producto del coeficiente β 
1
​
 y un círculo con la letra R dentro que representa Dietaᵢ, más el producto del coeficiente β 
2
​
 y un icono de cara de bebé que representa Edadᵢ. La siguiente línea agrega el producto del coeficiente β 
3
​
 y un icono de dinero que representa Ingresosᵢ, más el producto del coeficiente β 
4
​
 y un icono de estrella brillante que representa Actividadᵢ, y finalmente el término de error ε 
i
​
 . Esta fórmula parece ser un modelo de análisis de regresión que examina el impacto de la dieta, la edad, los ingresos y los niveles de actividad en la salud mental de un individuo.
    Magic Regression
📊 Core Findings
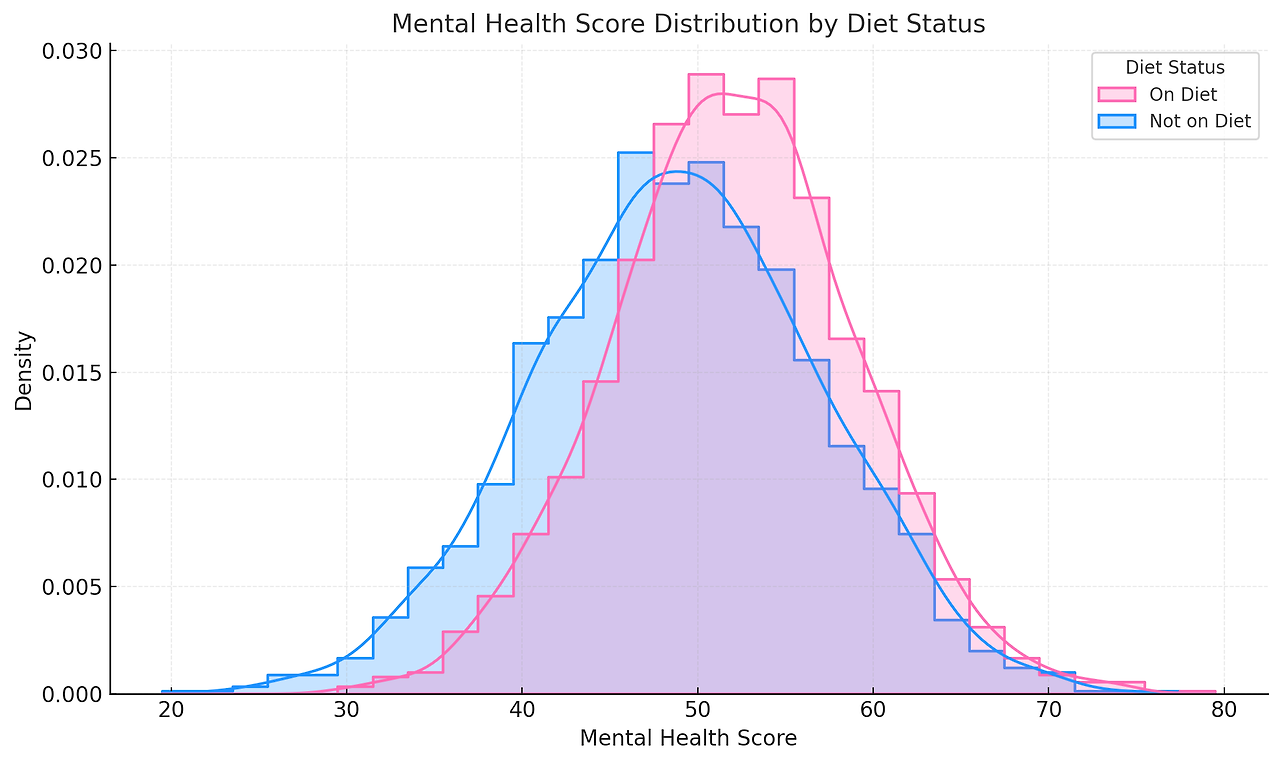
  • 🍽️ Diet Status: β = +1.23, p = 0.003 ✅
    Individuals actively on a diet scored 1.23 points higher on average in mental health assessments. This supports the idea that taking ownership of your body positively influences your inner dialogue and self-perception. It’s not just the waistline that’s transforming — it’s identity and confidence, too.
  • 💸 Income: β = +0.015, p = 0.000 ✅
    Each million KRW increase in income correlated with a 1.5-point increase in mental health scores. While money can't buy happiness, it can cushion stressors and provide choices — both critical to emotional resilience.
  • 🏃 Physical Activity: β = +0.42, p = 0.001 ✅
    With each additional workout session per week, mental health scores improved. Endorphins, structure, and the simple act of showing up all matter. Movement becomes medicine — one step, one breath, one lift at a time.
  • 👶 Age: β = -0.08, p = 0.041 ✅
    Mental health tends to slightly decline with age. Not alarmingly so, but enough to remind us that emotional stamina, like physical strength, requires regular workouts — kindness, reflection, rest, and community.
📈 Let the Data Speak
English: A LOWESS smoothing curve with a 95% confidence interval graph showing Mental Health Score versus Monthly Income (in thousands of Won). The graph is separated into two groups based on Diet Status (0: No Diet, 1: Diet). Light blue 'x' markers represent data for individuals not on a diet, and salmon-colored 'x' markers represent data for individuals on a diet. The light blue solid line represents the LOWESS smoothing curve for the No Diet group, and the salmon-colored solid line represents the LOWESS smoothing curve for the Diet group. Overall, there is a trend of increasing mental health score with increasing income, with a more pronounced increase in the Diet group.
日本語: 月間収入(単位:千ウォン)に対する精神的健康スコアを示すLOWESS平滑化曲線と95%信頼区間グラフです。グラフは食事状況(0:食事なし、1:食事あり)に基づいて2つのグループに分けられています。水色の「x」印は食事をしていない人のデータを表し、サーモンピンクの「x」印は食事をしている人のデータを表しています。水色の実線は食事をしていないグループのLOWESS平滑化曲線を表し、サーモンピンクの実線は食事をしているグループのLOWESS平滑化曲線を表しています。全体的に、収入が増加するにつれて精神的健康スコアが上昇する傾向があり、特に食事をしているグループでより顕著な上昇が見られます。
中文 (简体): 显示根据每月收入(单位:千韩元)划分的精神健康评分的 LOWESS 平滑曲线和 95% 置信区间图。该图根据饮食状况(0:无节食,1:节食)分为两组。浅蓝色“x”标记代表未节食个体的数据,鲑鱼色“x”标记代表节食个体的数据。浅蓝色实线代表未节食组的 LOWESS 平滑曲线,鲑鱼色实线代表节食组的 LOWESS 平滑曲线。总体而言,随着收入的增加,精神健康评分呈现上升趋势,尤其是在节食组中,上升趋势更为明显。
Deutsch: Eine LOWESS-Glättungskurve mit 95%-Konfidenzintervall-Diagramm, das den psychischen Gesundheitswert im Verhältnis zum monatlichen Einkommen (in Tausend Won) zeigt. Das Diagramm ist nach dem Diätstatus (0: keine Diät, 1: Diät) in zwei Gruppen unterteilt. Hellblaue
A LOWESS smoothing curve with a 95% confidence interval graph showing Mental Health Score versus Monthly Income
English: A line graph showing the trend of Mental Health Score by Age and Diet Status. The pink line and shaded area represent the average mental health score and 95% confidence interval for the 'On Diet' group, while the blue line and shaded area represent the average mental health score and 95% confidence interval for the 'Not on Diet' group. The x-axis represents Age, and the y-axis represents Mental Health Score. Overall, both groups show variability in mental health score across age, but the 'On Diet' group tends to maintain a slightly higher average mental health score than the 'Not on Diet' group.
日本語: 年齢と食事状況別の精神的健康スコアの傾向を示す折れ線グラフです。ピンクの線と影付き領域は「食事中」グループの平均精神的健康スコアと95%信頼区間を示し、青い線と影付き領域は「食事なし」グループの平均精神的健康スコアと95%信頼区間を示しています。x軸は年齢、y軸は精神的健康スコアを示しています。全体的に、両方のグループで年齢による精神的健康スコアの変動が見られますが、「食事中」グループは「食事なし」グループよりもわずかに高い平均精神的健康スコアを維持する傾向があります。
中文 (简体): 一张折线图,显示了按年龄和饮食状况划分的心理健康评分趋势。粉色线条和阴影区域代表“节食中”组的平均心理健康评分和 95% 置信区间,而蓝色线条和阴影区域代表“未节食”组的平均心理健康评分和 95% 置信区间。x 轴表示年龄,y 轴表示心理健康评分。总体而言,两组的心理健康评分都随年龄有所波动,但“节食中”组的平均心理健康评分往往略高于“未节食”组。
Deutsch: Ein Liniendiagramm, das den Trend des psychischen Gesundheitswertes nach Alter und Diätstatus zeigt. Die pinkfarbene Linie und der schattierte Bereich stellen den durchschnittlichen psychischen Gesundheitswert und das 95%-Konfidenzintervall für die Gruppe
A line graph showing the trend of Mental Health Score by Age and Diet Status.
English: A density histogram showing the distribution of Mental Health Score by Diet Status. The pink histogram and curve represent the distribution of mental health scores for the 'On Diet' group, while the blue histogram and curve represent the distribution for the 'Not on Diet' group. The x-axis represents Mental Health Score, and the y-axis represents Density. The distribution for the 'On Diet' group is slightly shifted to the right compared to the 'Not on Diet' group, suggesting that individuals on a diet tend to have slightly higher mental health scores overall. Both distributions appear approximately normal.
日本語: 食事状況別の精神的健康スコアの分布を示す密度ヒストグラムです。ピンク色のヒストグラムと曲線は「食事中」グループの精神的健康スコアの分布を示し、青色のヒストグラムと曲線は「食事なし」グループの分布を示しています。x軸は精神的健康スコア、y軸は密度を示しています。「食事中」グループの分布は「食事なし」グループと比較してわずかに右にシフトしており、これは食事をしている人の方がしていない人よりも全体的にわずかに高い精神的健康スコアを持つ傾向があることを示唆しています。どちらの分布もほぼ正規分布の形状を示しています。
中文 (简体): 一张密度直方图,显示了按饮食状况划分的心理健康评分分布。“节食中”组的心理健康评分分布用粉色直方图和曲线表示,“未节食”组的分布用蓝色直方图和曲线表示。x 轴表示心理健康评分,y 轴表示密度。“节食中”组的分布相对于“未节食”组略微向右偏移,这表明节食的人总体上往往比不节食的人拥有稍高的心理健康评分。两种分布都近似于正态分布。
Deutsch: Ein Dichtehistogramm, das die Verteilung des psychischen Gesundheitswertes nach Diätstatus zeigt. Das pinkfarbene Histogramm und die Kurve stellen die Verteilung der psychischen Gesundheitswerte für die Gruppe
A density histogram showing the distribution of Mental Health Score by Diet Status.

 
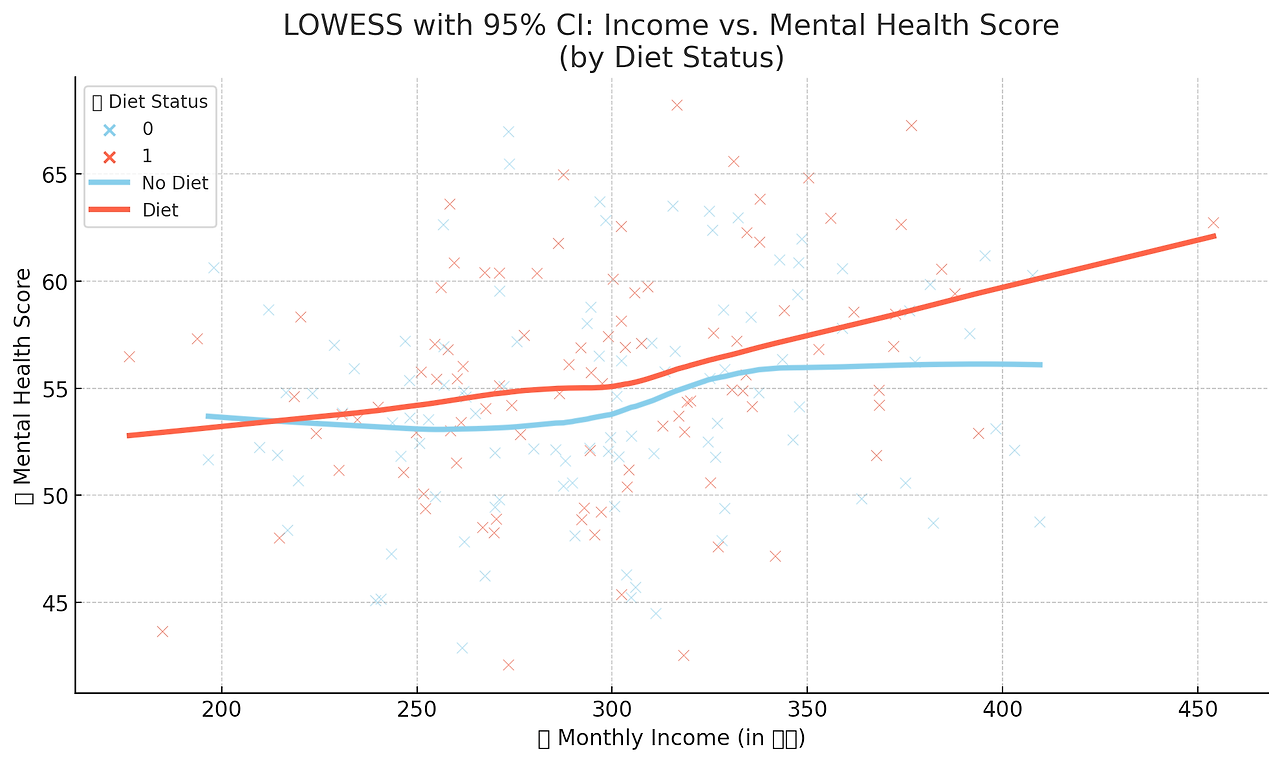
“Higher income boosts mental health — especially for those actively working on their body.”
“Regardless of age, dieters consistently show better mental health compared to non-dieters.”
“A body in motion heals a mind in pain.”
When the body moves with purpose, the soul follows in rhythm. It’s more than calories burned — it’s clarity gained.

📚 Quote to Remember

🌱 "He who masters his body,

also masters his mind."

— James Allen,

Author of 'As a Man Thinketh'
A timeless reminder from the British philosopher that self-discipline in the physical realm cultivates clarity, serenity, and purpose in the emotional one.

📖 References
  • Youth Panel Survey (YPS), Korea Employment Information Service. Longitudinal data collected over 10+ years, monitoring lifestyle, employment, and emotional health of Korean youth.
  • Smith, J. (2018). Body Image and Mental Health among Young Adults. Journal of Health Psychology. A seminal study linking personal body perception and cognitive-emotional well-being.
  • Kim, Y.J. et al. (2022). "Correlation between Dieting and Perceived Stress." Korean Journal of Public Health. This paper explores stress-reduction effects through active dietary management and body awareness.

🔮 Coming Up Next

👉 In the next episode, we’ll uncover how physical exercise reshapes not just bodies but entire life outlooks. Through real tracking of mental health scores over months of regular activity, we reveal the most surprising and empowering curves of transformation.

🏃‍♂️ Three months into regular workouts — will mental health truly surge?
Tune in as we unveil the statistics, the psychology, and the soul of this journey.

💌 The magic continues — in numbers, in healing, and in you.
#DietDataSeries #DataWhizard #BodyMindConnection #EmotionalAnalytics


🧙 The Data Whizard®
Ph.D. in Economics | Award-winning analyst in data and behavioral science
✨ Data | Storytelling | Behavioral Psychology | Emotional Science
📧 Contact: the.datawhizard@gmail.com

 
🎠 “This isn’t a subscribe bait...
Just a hope your finger might accidentally tap that button.
 
© The Data Whizard | Sharing data stories with emotional insight.
Unauthorized reproduction or commercial use is strictly prohibited.


🧙‍♂️ The Data Whizard®
✨ Master of Data Alchemy — Unraveling every dataset on Earth
📊 The Data Whizard | Spoon-feeding Data Like Magic
🎓 Ph.D. in Economics — Expert in Data Economics
🏆 3-Time Grand Slam Champion in Big Data Competitions
  (Top Prize | Excellence Award | Best Paper)
📘 Executive Editor, Journal of Information Technology Applications and Management
🧠 Senior Analyst, Korea Citation Index (KCI) —
  18 peer-reviewed journal publications in the past 4 years
🧪 Head of the 🔮 Data Spell Lab — Recipes for Predictive Magic
💡 Where there's an ‘h’, there's high-quality insight.
  Not all wizards wear robes — some carry regression plots.
📧 Collab | Data Projects | Speaking Inquiries
  → the.datawhizard@gmail.com

more: https://myblog7295.tistory.com/entry/💪《Diet-Powered-by-Data⑤》😳After-I-slimmed-down-I-got-more-texts [🧙‍♂️데이터 블렌딩 마법사🧙‍♂️The Data Whizard:티스토리]

반응형