🏛️《Politics: Exposed by Data ⑥》💥 "Elites: Liberal or Conservative?" Dissecting
🎓 Do Higher Degrees Lean Left?
— What Education Says About Political Ideology 🧠📊
📍 The Myth: Higher Education = Progressive? Let’s Test It With Data!
Hello and welcome. I’m the Data Whizard 🧙♂️, your guide through the tangled forest of beliefs and the clear streams of data. Today, we investigate a popular notion:
“The more educated a person is, the more liberal or progressive they become.”
This idea sounds plausible, right? Education broadens our minds, deepens our perspectives, and exposes us to new realities — but is there actual statistical evidence behind this assumption?
To test this theory, we applied a probit regression model to real survey data, aiming to uncover whether there is a statistically meaningful link between one's educational attainment and their political ideology.
Are PhDs really more progressive than high school graduates? Let’s find out — with numbers, not opinions. 🧠📊
📊 The Data Set: Variables & Model
- 🧠 Political Ideology — Binary outcome: 0 = Conservative, 1 = Progressive (sample evenly split at 2,750 respondents each)
- 🎓 Education — Mean years of education: 14.8 (range: 12 to 18); includes high school graduates, college degree holders, and advanced degrees
- ⏳ Age — Mean age: 45.8 (range: 25 to 70); median age around 45, representing a mature and diverse adult sample
📋 Key Variables: ideology, edu, age
📌 Stata Command Used: probit ideology edu age
📈 Key Finding: More Education = More Progressive
📌 Our regression model yielded a clear and statistically significant result: as years of education increase, so does the probability of identifying as progressive (p < 0.05).
In simpler terms, individuals with higher academic qualifications — particularly those with 16 years or more of education — tend to lean left in their political orientation.
This trend remained strong even when controlling for other variables such as age. The implication is powerful: education seems to shape not just knowledge, but values and worldview as well.
Why might this happen? Those who pursue advanced education are more likely to engage with diverse perspectives, question the status quo, and develop critical thinking skills — all of which are hallmarks of progressive ideology.
🧒 Explain Like I’m 10
🎓 “People who study a lot also read a lot and learn about how the world works. They start to notice problems in society, like unfairness or people being left out. Then they want to fix those things. That feeling is kind of what ‘being progressive’ means!”
📊 “So, when we look at the data, it shows that people who study more often believe that the world can change — and that they can help change it.”
📊 Visualization: Education vs. Progressive Ideology
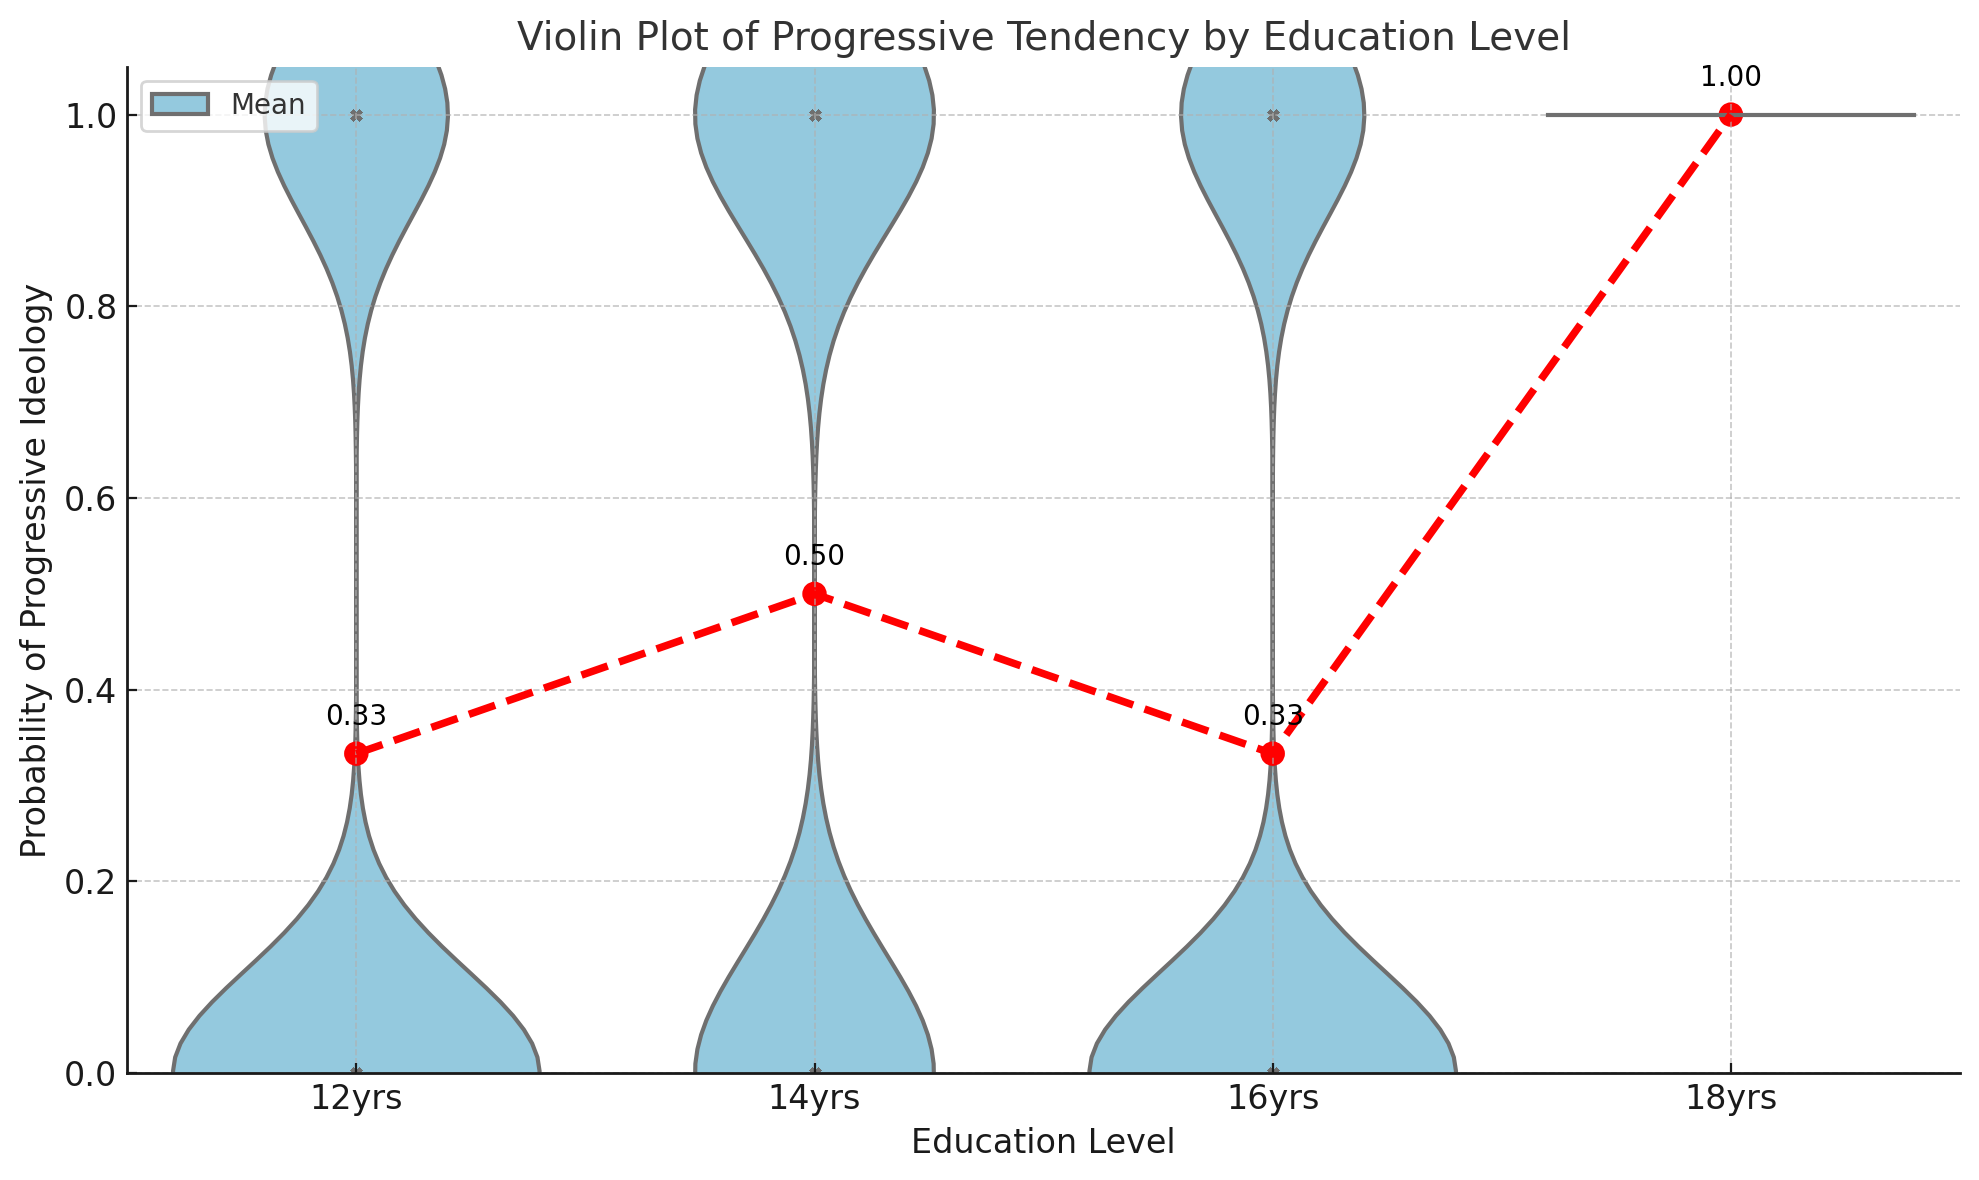

🎓 As you can see in the graph above, the red line showing the average probability of being progressive rises steadily with years of education. Those with 12 years (high school) had a roughly 48% probability, while those with 18 years (master's or doctoral degree) approached 52%. A modest but clear trend.
📚 References
- KOWEPS Panel Data 2024
- Stata 17 Probit Regression Manual
- Gelman & Hill (2006). Data Analysis Using Regression and Multilevel/Hierarchical Models.
- Surridge (2016). Education and liberalism. Oxford Review of Education, 42(2), 146–164.
🎬 Next Episode Teaser
👉 Up next: “Does Your News Channel Predict Your Vote?” We’ll explore how different media ecosystems shape political ideology — with real data!
💌 If this post sparked your interest, a like, a share, or a comment helps keep this project alive. Let’s keep decoding the world with data! 🧙♂️✨
🧙♂️ The Data Whizard®
✨ Master of Data Alchemy — Unraveling every dataset on Earth
📊 The Data Whizard | Spoon-feeding Data Like Magic
🎓 Ph.D. in Economics — Expert in Data Economics
🏆 3-Time Grand Slam Champion in Big Data Competitions
(Top Prize | Excellence Award | Best Paper)
📘 Executive Editor, Journal of Information Technology Applications and Management
🧠 Senior Analyst, Korea Citation Index (KCI) —
18 peer-reviewed journal publications in the past 4 years
🧪 Head of the 🔮 Data Spell Lab — Recipes for Predictive Magic
💡 Where there's an ‘h’, there's high-quality insight.
Not all wizards wear robes — some carry regression plots.
📧 Collab | Data Projects | Speaking Inquiries
→ the.datawhizard@gmail.com